
A public-data study by Jimenez Mazzitelli Mordes — a bilingual litigation and personal injury law firm serving Florida, Texas & New York
Reviewed by the attorneys of Jimenez Mazzitelli Mordes
Where Freight Meets Traffic: Commercial Motor Vehicle Crashes in Miami-Dade
Miami-Dade records more commercial motor vehicle crashes than any other Florida county — 8,546 in 2024, about one every 62 minutes. And while injuries across all county crashes have stayed nearly flat, injuries in crashes involving commercial vehicles are up 25.3% since 2021.
The study in brief
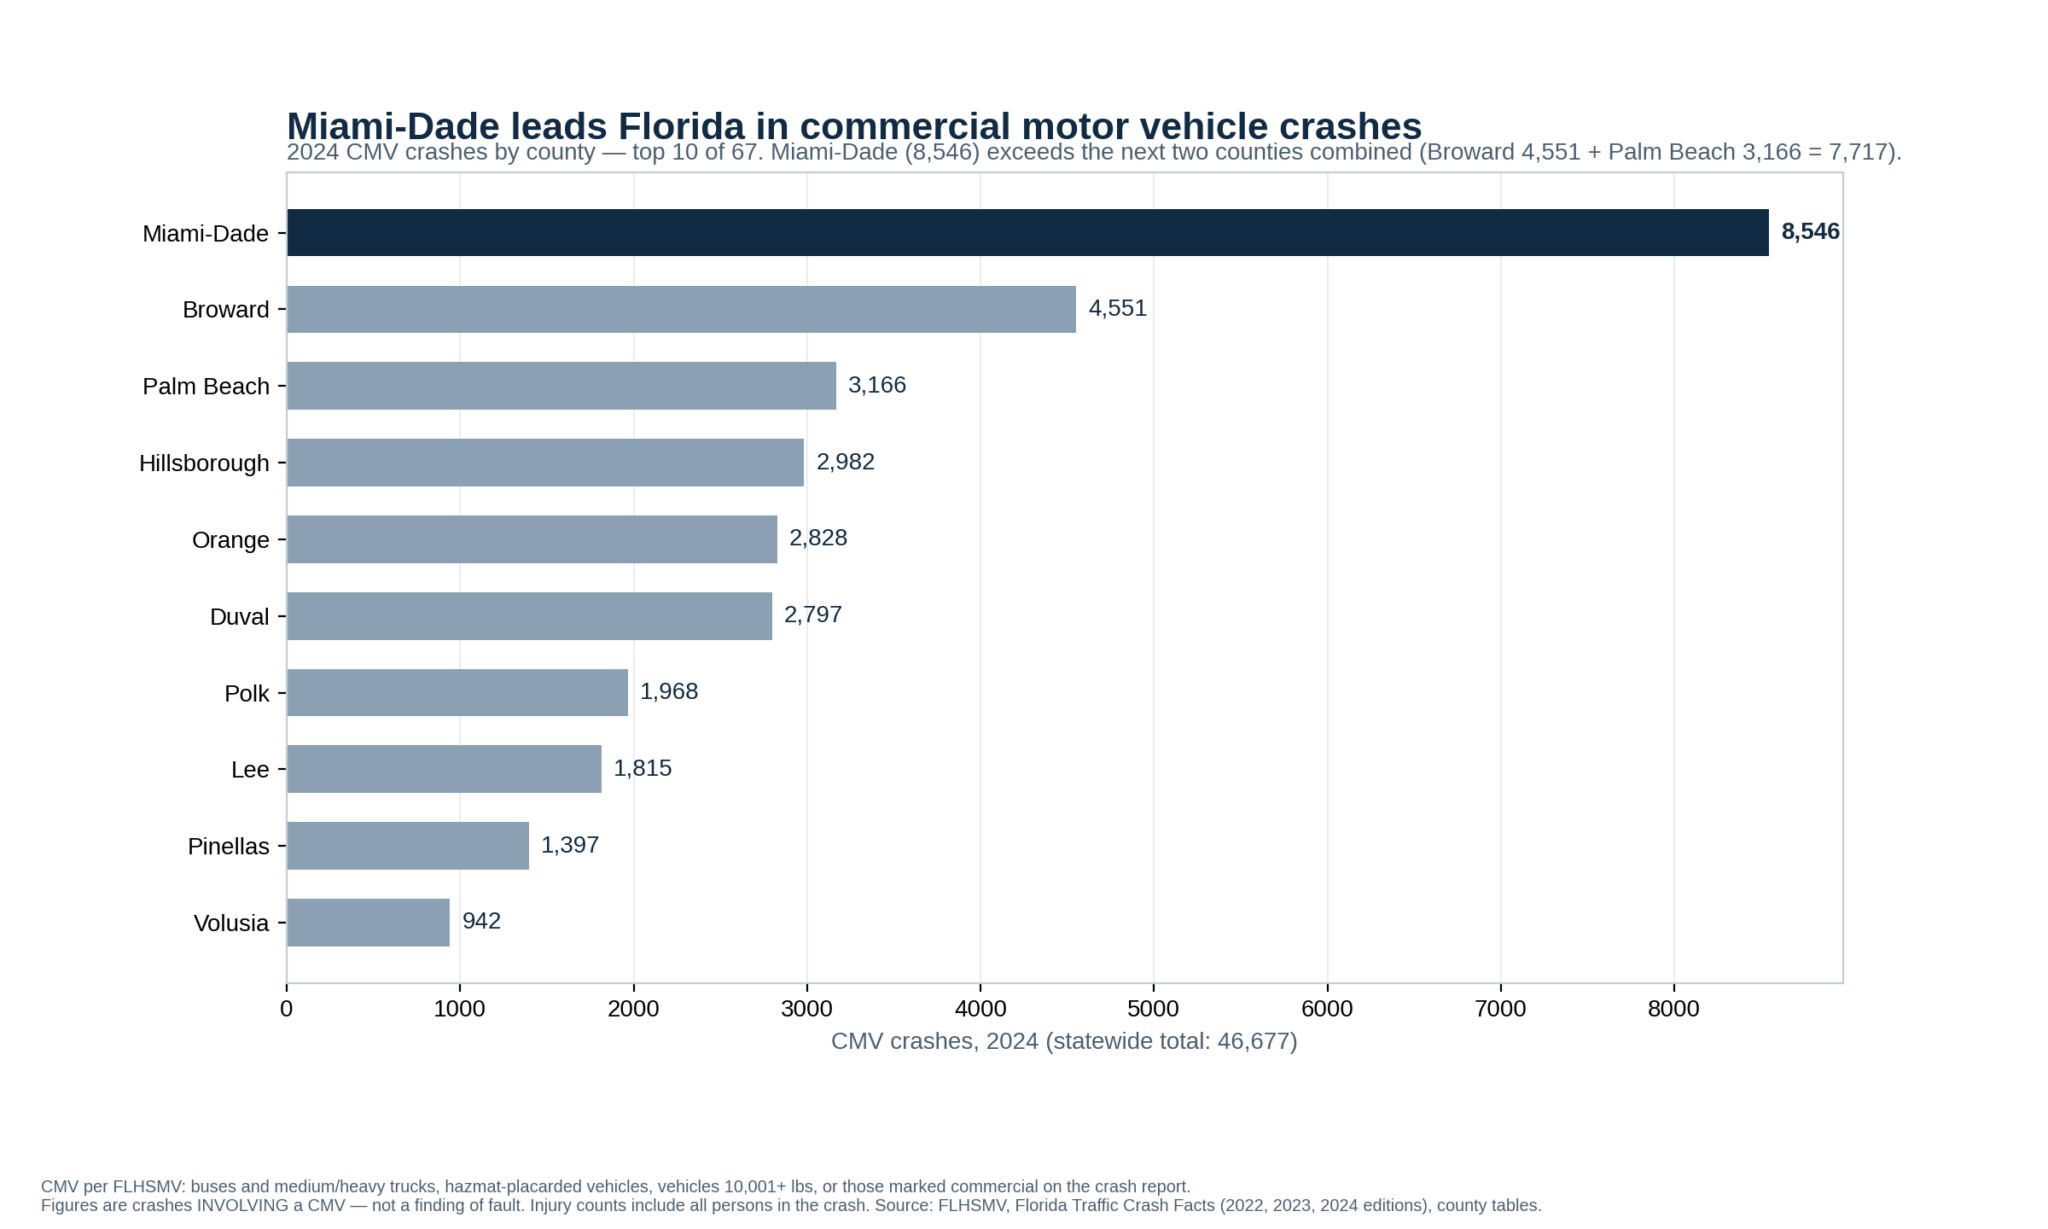
- 8,546 CMV crashes in Miami-Dade in 2024 — more than the next two counties combined (Broward 4,551 + Palm Beach 3,166 = 7,717), and 18.3% of Florida’s 46,677 CMV crashes.
- 23.4 CMV crashes per day (8,546 ÷ 366 days) — roughly one every 62 minutes, around the clock, all year.
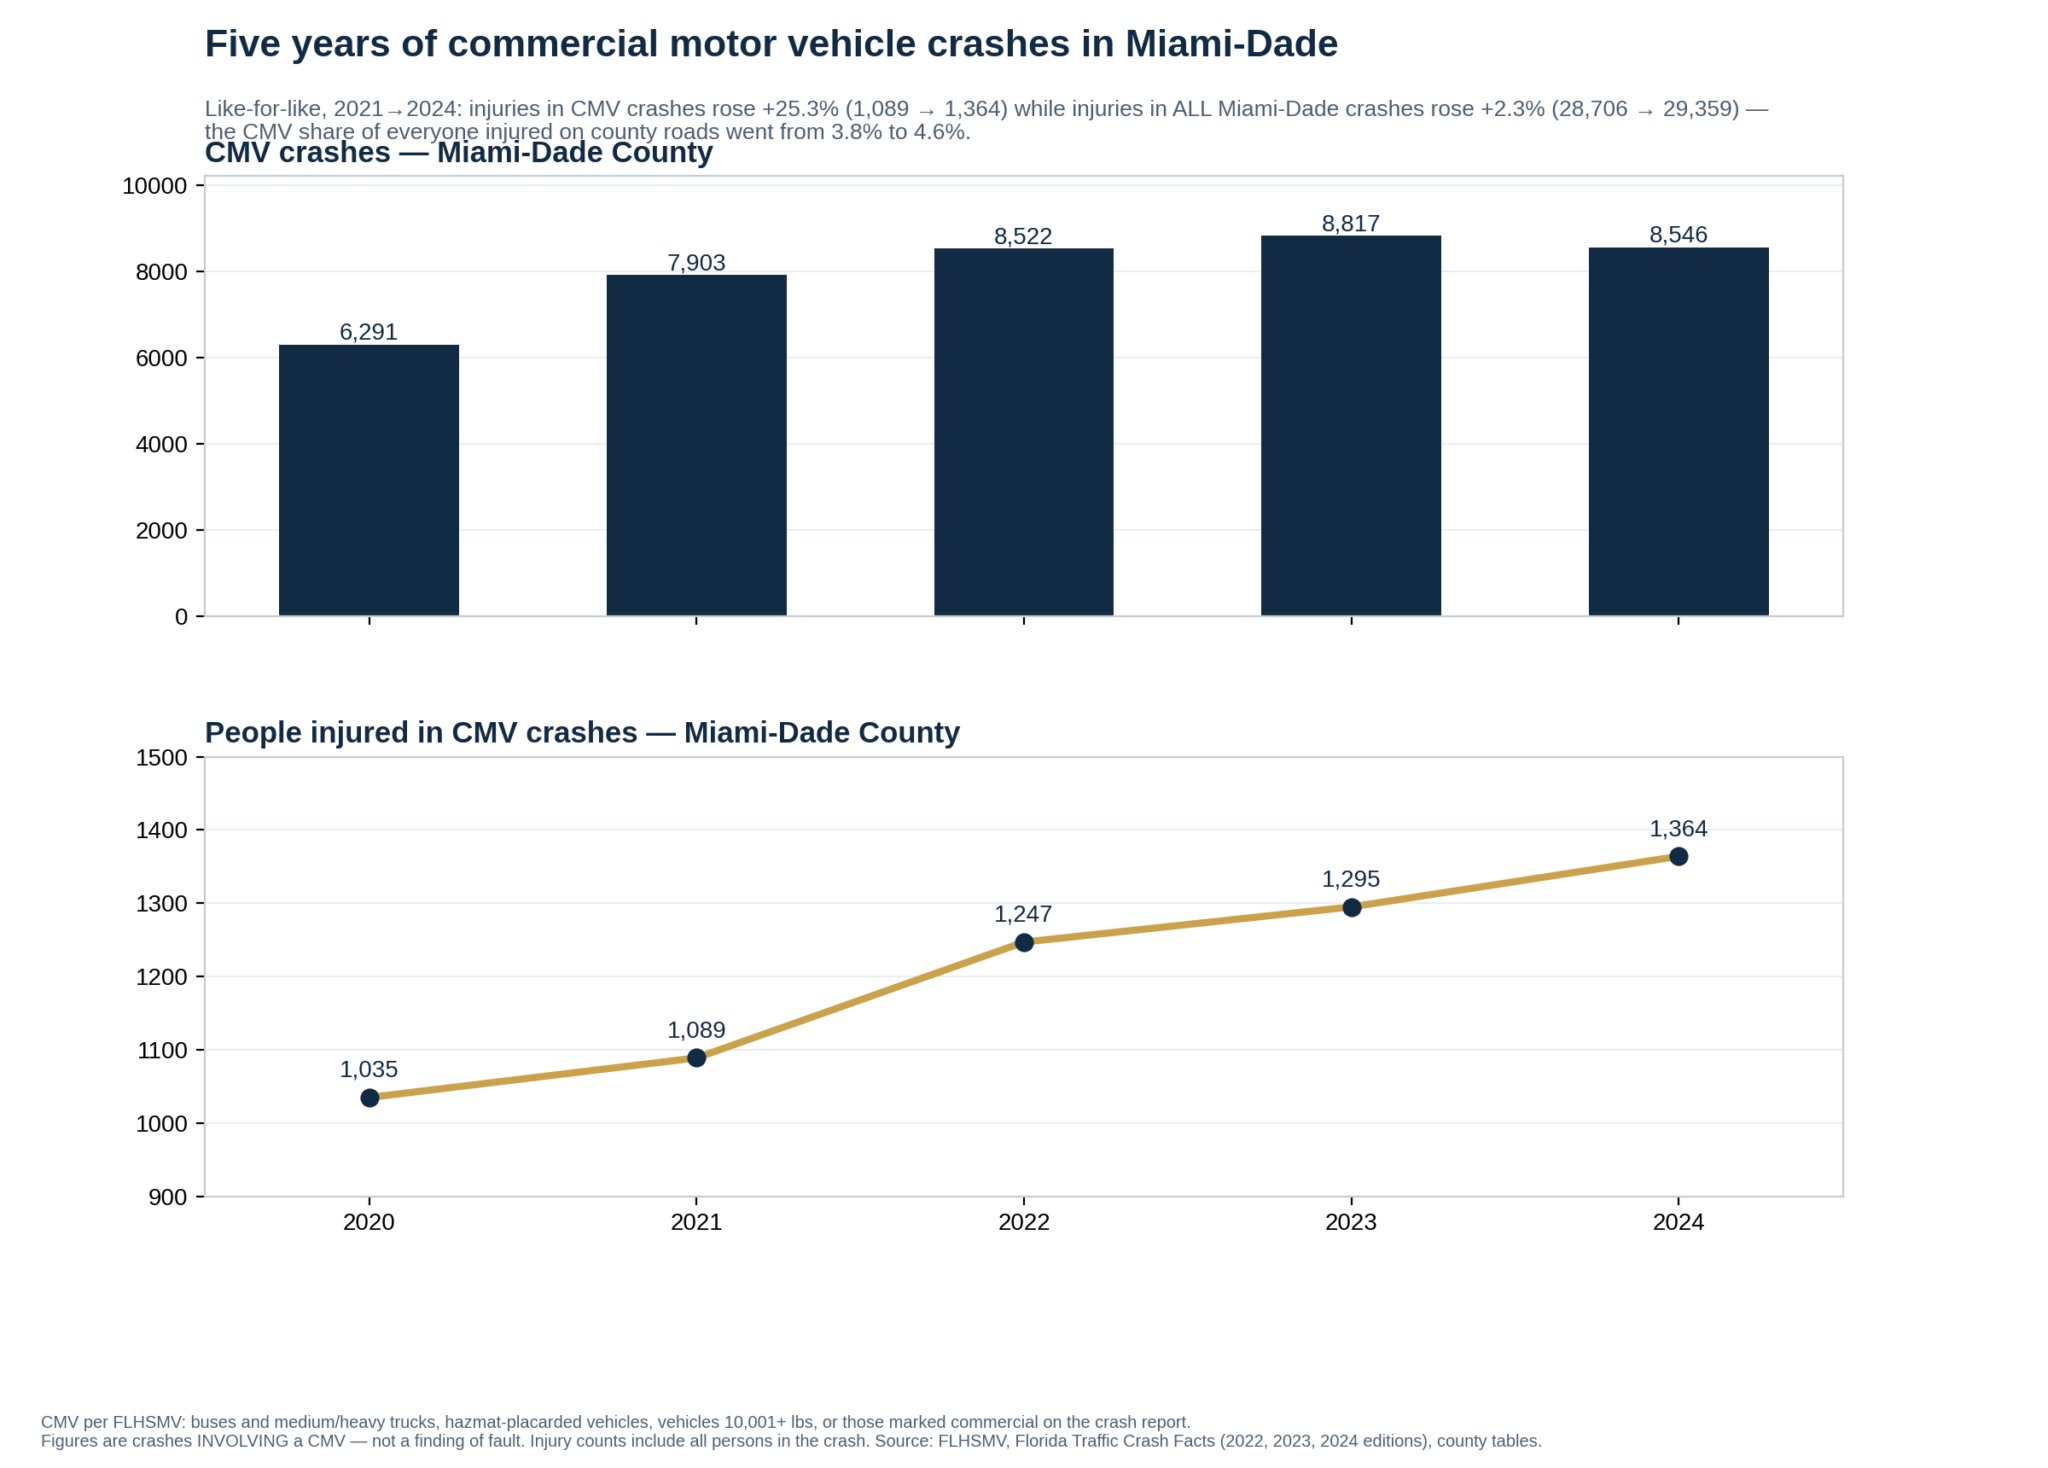
- Injuries in CMV crashes rose +25.3% from 2021 to 2024 (1,089 → 1,364), while injuries in all Miami-Dade crashes rose +2.3% (28,706 → 29,359) over the same years. The CMV share of everyone injured on county roads went from 3.8% to 4.6%.
- 14.2% of all Miami-Dade crashes involved a CMV in 2024 (8,546 of 60,000) — above the statewide 12.2% and Broward’s 11.9%.
- Nationally, 47% of large-truck crash deaths happen between 6 a.m. and 3 p.m., versus 28% of deaths in crashes not involving a large truck — against a baseline of 37.5% (that window’s share of the day). (IIHS, a separately defined federal category — see the time-of-day section.)
CMV per FLHSMV: buses and medium/heavy trucks, hazmat-placarded vehicles, vehicles with a gross, declared or actual weight rating of 10,001 lbs or more, or vehicles marked commercial on the crash report. Figures are crashes involving a commercial motor vehicle — not a finding of fault. Injury counts include all persons in the crash, not only CMV occupants. Source: FLHSMV, Florida Traffic Crash Facts, 2022–2024 editions.
Miami-Dade leads the state — by a wide margin
Florida recorded 46,677 commercial motor vehicle crashes in 2024. Nearly one in five of them — 18.3% — happened in Miami-Dade County. The county’s 8,546 CMV crashes exceed Broward and Palm Beach combined, and its lead is consistent: Miami-Dade’s share of the state’s CMV crashes was 18.1% in 2022 and 18.7% in 2023.
Miami-Dade is a large county in every respect — it also accounts for 15.7% of Florida’s crashes overall. But its commercial-vehicle exposure runs above even that baseline: 14.2% of the county’s own crashes involved a CMV in 2024, compared with 12.2% statewide and 11.9% in neighboring Broward.
The five-year trend: crashes plateau high, injuries keep climbing
Miami-Dade’s CMV crash count climbed steeply out of 2020 (6,291) to a 2023 peak of 8,817 and stayed near that level in 2024 (8,546). The injury line tells the harder story: people injured in the county’s CMV crashes have risen every single year of the series — 1,035, 1,089, 1,247, 1,295, 1,364.
The like-for-like comparison is what makes that increase stand out. From 2021 to 2024, injuries in all Miami-Dade crashes rose just 2.3% (28,706 → 29,359) — while injuries in CMV crashes rose 25.3% (1,089 → 1,364). Commercial-vehicle crashes went from 3.8% to 4.6% of everyone injured on the county’s roads. Over the same period, total county crashes actually fell 4.1% (62,536 → 60,000), county traffic deaths fell from 352 to 272, and CMV crash deaths fell from 27 to 18 — the injury climb is specific, not part of a general worsening.
When large-truck crashes turn deadly: the working day
Florida’s county tables don’t break crashes out by time of day, but the national fatality data does — for a related, separately defined category. Per IIHS analysis of 2024 federal FARS data, 47% of deaths in large-truck crashes occurred between 6 a.m. and 3 p.m., versus 28% of deaths in crashes not involving a large truck. That nine-hour window is 37.5% of the day — the baseline both numbers should be read against. Within the truck series: 14% of deaths at 6–9 a.m., 14% at 9 a.m.–noon, 18% at noon–3 p.m.
Of the 5,340 people killed in U.S. large-truck crashes in 2024, 17% were truck occupants, 62% were occupants of cars and other passenger vehicles, and 19% were pedestrians, bicyclists or motorcyclists.
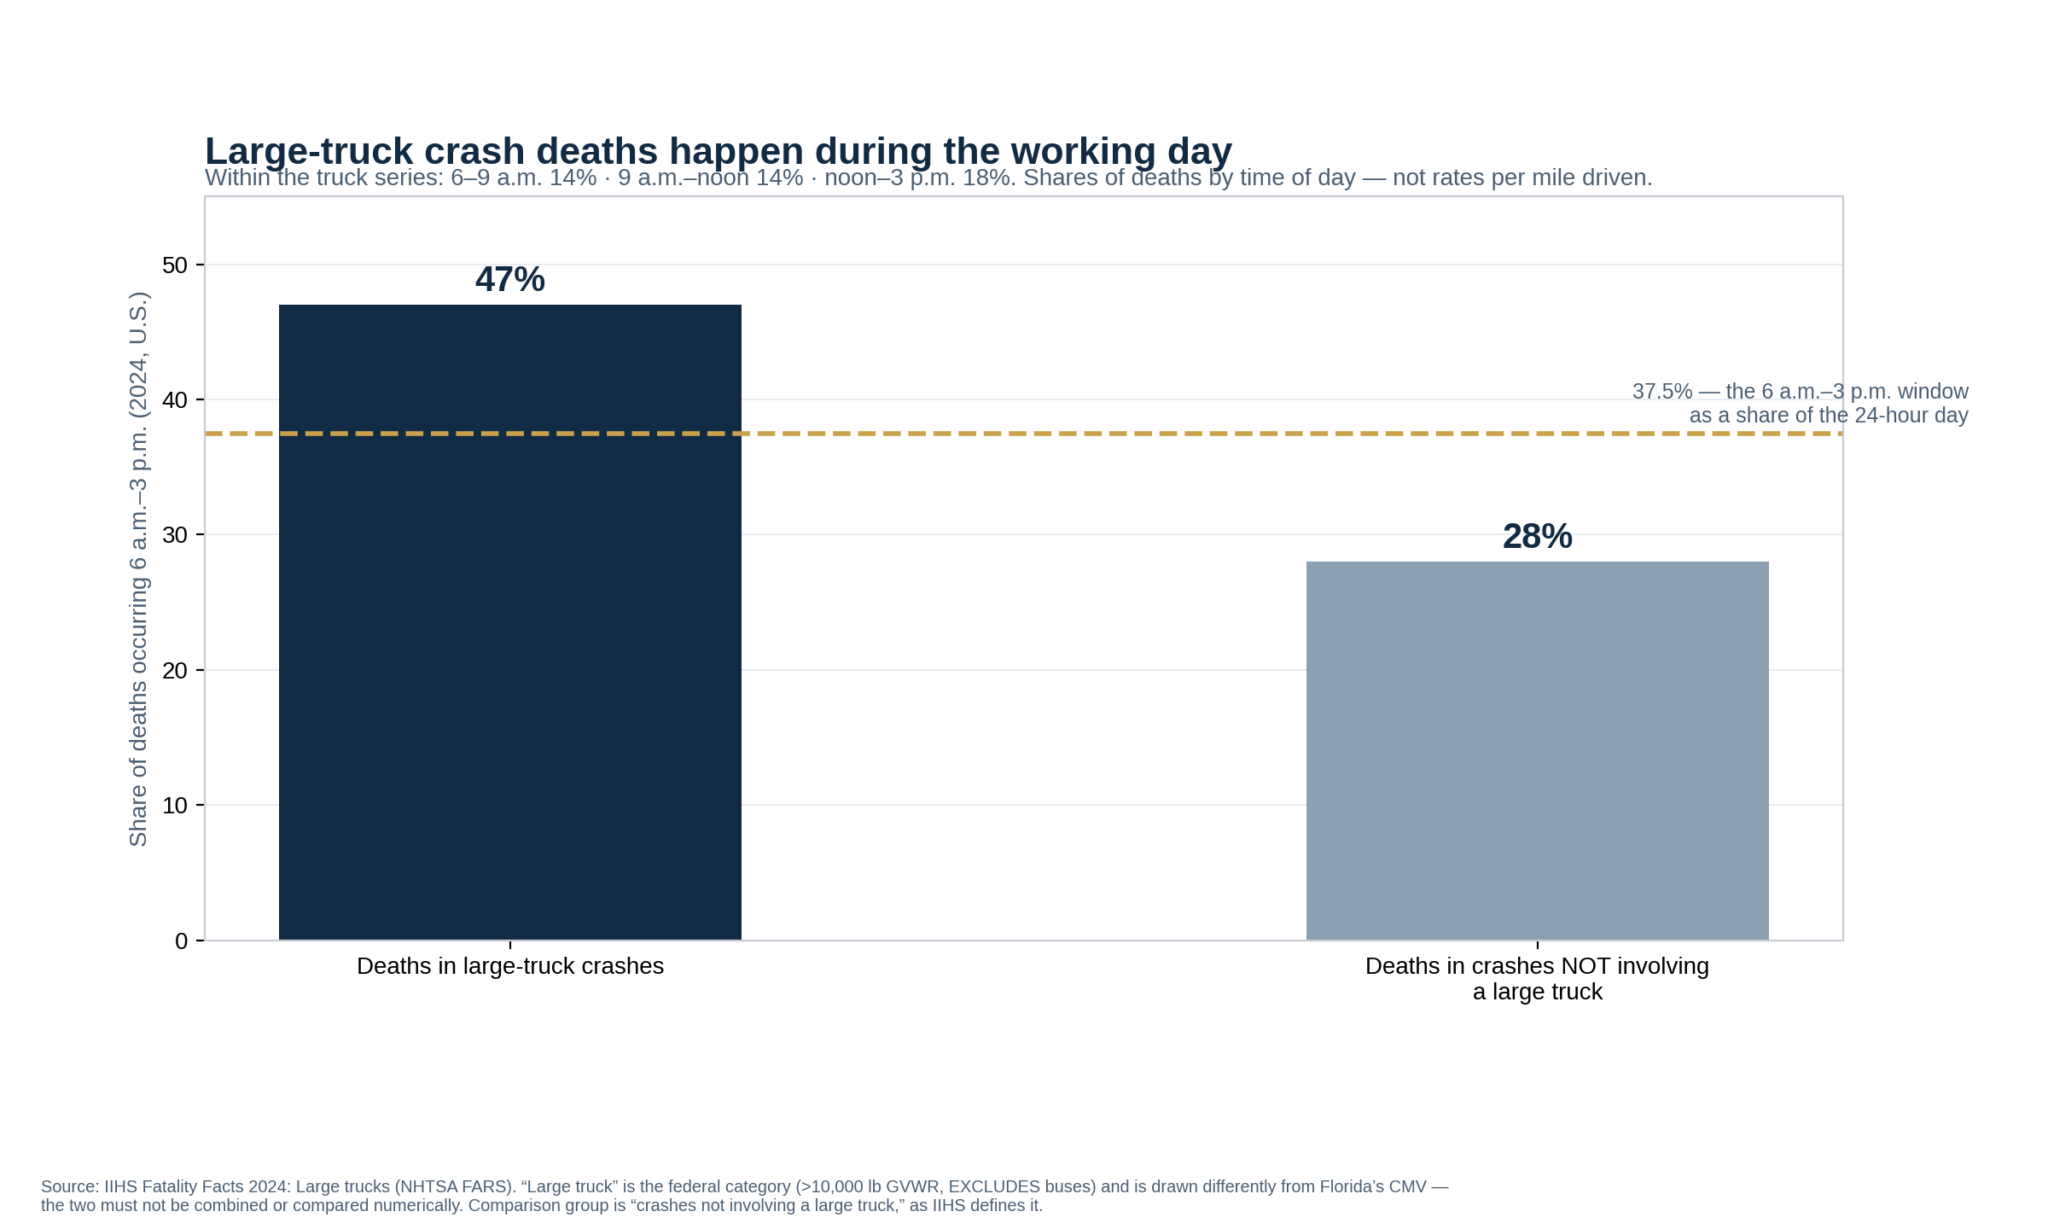
“Large truck” is the IIHS/NHTSA federal category (over 10,000 lb GVWR) and is drawn differently from Florida’s CMV — the federal category excludes buses, which Florida’s definition includes. The two are reported separately here and are never combined. These are shares of deaths by time of day, not rates per mile driven.
The freight geography behind the numbers
Miami-Dade’s commercial-vehicle volume is not an accident of geography — it is the geography. Miami International Airport moved nearly 3.5 million tons of freight in 2025, up 13.6%, making it the busiest U.S. airport for total freight and third in the world behind Hong Kong and Shanghai, with Q1 2026 up a further 15.7% (Miami-Dade County Aviation Department, May 4, 2026, citing Airports Council International rankings). PortMiami adds seaborne cargo on the county’s eastern edge. Between them sits the Doral warehouse and distribution belt, stitched to the airport’s cargo ramps and the port by the Palmetto Expressway (SR-826) and the Dolphin Expressway (SR-836).
Every one of those tons moves its last mile on a truck, sharing the county’s roads with nearly 2.8 million residents. This study deliberately attaches no crash counts to individual roads — the section below explains why.
What we found and chose not to publish
We originally set out to rank individual corridors — SR-826, SR-836, NW 25th Street — by commercial-vehicle crash count, using FDOT’s public SSOGIS crash-mapping tool. We killed that section after verification. SSOGIS is a safety-engineering locator file published under a federal restriction (23 U.S.C. § 409) limiting it to safety-planning use; its crash universe differs from the state’s statistics of record by as much as 53% for Miami-Dade; its commercial-vehicle flag has no published definition and runs materially narrower than FLHSMV’s; and corridor attribution proved unstable — the same road returns counts differing by nearly a factor of two depending on invisible definitional choices. Recent years are also largely absent from the tool. A corridor ranking built on that foundation would not survive scrutiny, so we did not publish one. Every figure on this page comes instead from FLHSMV’s annual Florida Traffic Crash Facts — the state’s statistics of record.
Why commercial-vehicle crashes are legally different
Three things separate a commercial-vehicle crash from an ordinary collision:
- Federal oversight. Motor carriers are governed by Federal Motor Carrier Safety Administration rules — hours-of-service limits, maintenance requirements, and liability minimums a passenger driver never faces.
- Electronic evidence on a clock. Modern commercial vehicles record pre-crash speed, braking, steering and driving hours (ELD/ECM “black box” data). That data can be overwritten within days; preserving it through a legal spoliation letter is often decisive.
- Multi-party liability. Unlike a two-car crash, a commercial collision can involve the driver, the motor carrier, the cab owner, the trailer owner, the freight broker and the cargo loader — each potentially carrying its own insurance.
The data
Miami-Dade commercial motor vehicle crashes, 2020–2024
| 2020 | 2021 | 2022 | 2023 | 2024 | |
|---|---|---|---|---|---|
| CMV crashes | 6,291 | 7,903 | 8,522 | 8,817 | 8,546 |
| CMV crash fatalities | 17 | 27 | 23 | 15 | 18 |
| People injured | 1,035 | 1,089 | 1,247 | 1,295 | 1,364 |
| All county crashes | — | 62,536 | 63,540 | 64,009 | 60,000 |
| All county injuries | — | 28,706 | 28,726 | 29,816 | 29,359 |
Top 10 Florida counties by CMV crashes, 2024
| Rank | County | CMV crashes | Fatalities | Injuries |
|---|---|---|---|---|
| 1 | Miami-Dade | 8,546 | 18 | 1,364 |
| 2 | Broward | 4,551 | 14 | 1,148 |
| 3 | Palm Beach | 3,166 | 16 | 714 |
| 4 | Hillsborough | 2,982 | 10 | 857 |
| 5 | Orange | 2,828 | 18 | 964 |
| 6 | Duval | 2,797 | 15 | 837 |
| 7 | Polk | 1,968 | 27 | 707 |
| 8 | Lee | 1,815 | 11 | 384 |
| 9 | Pinellas | 1,397 | 7 | 325 |
| 10 | Volusia | 942 | 6 | 250 |
CMV per FLHSMV: buses and medium/heavy trucks, hazmat-placarded vehicles, vehicles with a gross, declared or actual weight rating of 10,001 lbs or more, or vehicles marked commercial on the crash report. Figures are crashes involving a commercial motor vehicle — not a finding of fault. Injury counts include all persons in the crash, not only CMV occupants. Source: FLHSMV, Florida Traffic Crash Facts, 2022–2024 editions.
Methodology & sources
All Florida figures are taken directly from FLHSMV’s annual Florida Traffic Crash Facts reports — the state’s statistics of record — by downloading each edition’s PDF and reading the printed tables. County figures were validated by summing all 67 counties’ CMV crash counts to the published statewide total (exactly 46,677 for 2024). Percentages recompute from the published counts shown on this page. No figures were taken from dashboards, secondary summaries, or third-party datasets.
- FLHSMV, Florida Traffic Crash Facts 2024 — “2024-2022 CMV Crash and Injury History by County,” Miami-Dade row printed p.108; statewide CMV total printed p.111; county totals printed pp.55–61; CMV definition printed pp.3–4. flhsmv.gov/pdf/crashreports/2024-Crash-Report.pdf
- FLHSMV, Florida Traffic Crash Facts 2023 — CMV table, Miami-Dade row printed p.111; CMV definition printed p.3. flhsmv.gov/pdf/crashreports/crash_facts_2023.pdf
- FLHSMV, Florida Traffic Crash Facts 2022 — CMV table, Miami-Dade row printed p.114; county totals printed p.45. flhsmv.gov/pdf/crashreports/crash_facts_2022.pdf
- IIHS, Fatality Facts 2024: Large trucks (built on NHTSA FARS). iihs.org/research-areas/fatality-statistics/detail/large-trucks
- Miami-Dade County Aviation Department newsroom, May 4, 2026 (MIA freight rankings, citing ACI).
Figures on this page are shares and counts as published; no per-mile or per-vehicle rates are claimed. Crashes “involving” a CMV are not findings of fault. This study reports Florida’s CMV category and the federal “large truck” category separately; they are defined differently and are never combined. If you were hurt in a crash with a commercial truck, a Miami truck accident lawyer can explain how records like these apply to a claim.
Companion study: Walking and Biking in Miami-Dade — pedestrian and bicyclist crashes, 2021–2024.
Jimenez Mazzitelli Mordes is a bilingual litigation and personal injury law firm headquartered in Miami, serving clients across Florida, Texas, and New York. info@jmmlawfirm.com · (305) 548-8750

