
A public-data study by Jimenez Mazzitelli Mordes — a bilingual litigation and personal injury law firm serving Florida, Texas & New York · Published September 2026 · Data: Florida Department of Highway Safety and Motor Vehicles (FLHSMV) and U.S. Census Bureau
Walking and Biking in Miami-Dade: What Florida’s Crash Data Shows, 2021–2024
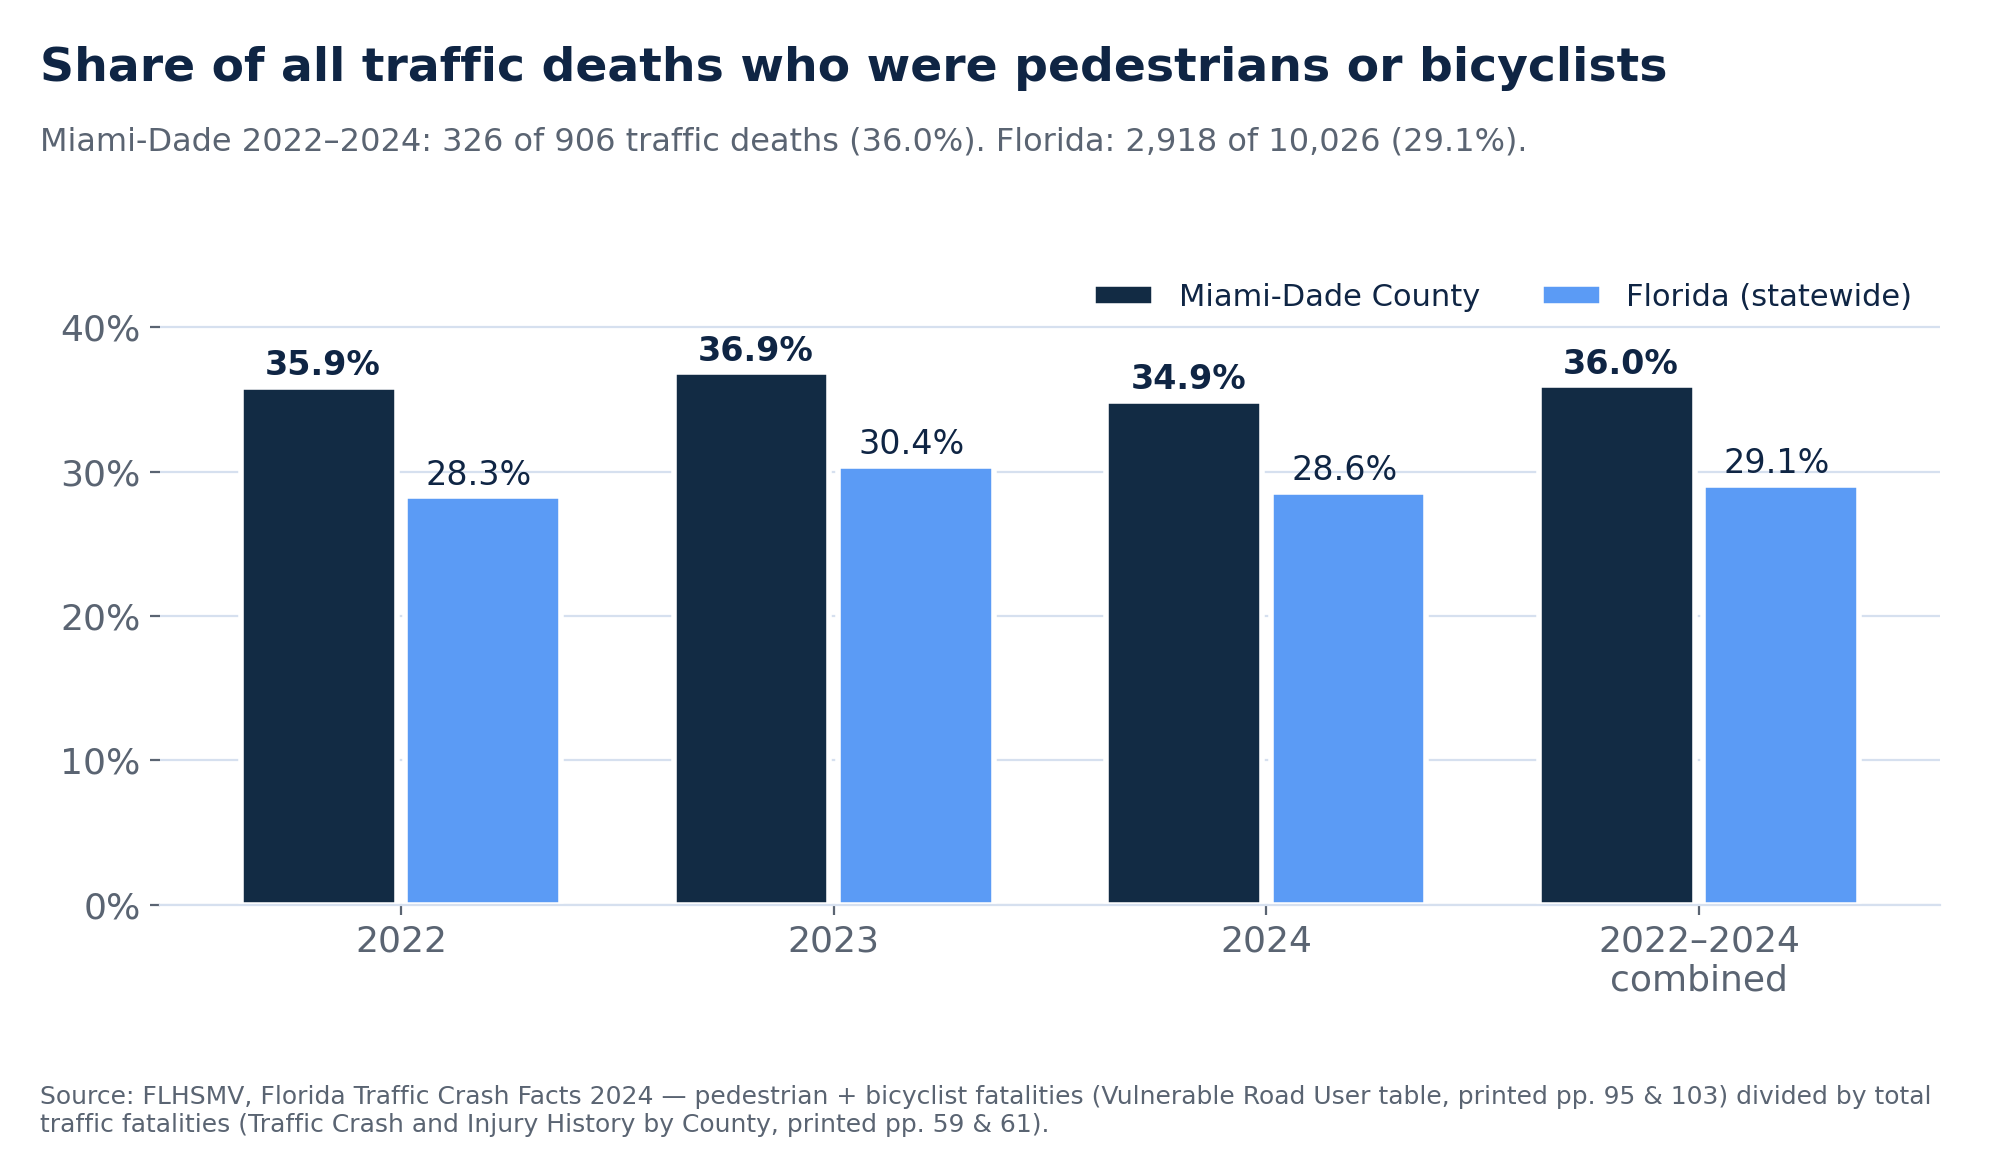
From 2022 through 2024, 36.0% of the people killed in traffic crashes in Miami-Dade County were pedestrians or bicyclists (326 of 906 deaths). Statewide, the figure was 29.1% (2,918 of 10,026). In 2024 the county also recorded more pedestrian crashes than any other Florida county.
Key findings
- More than a third of Miami-Dade traffic deaths were people walking or biking. In 2022–2024, pedestrians and bicyclists were 326 of the county’s 906 traffic fatalities (36.0%). The statewide share was 2,918 of 10,026 (29.1%). The county’s share was higher than the state’s in each of the three years: 35.9%, 36.9% and 34.9%, against 28.3%, 30.4% and 28.6% statewide. Source: FLHSMV.
- Miami-Dade had the most pedestrian crashes of Florida’s 67 counties in 2024: 1,876, followed by Broward with 1,219. That was 17.9% of Florida’s 10,501 pedestrian crashes, from a county with 12.1% of the state’s population. Per 100,000 residents, that is 66.7 pedestrian crashes, against 45.1 statewide, or about 5.1 pedestrian crashes a day (1,876 ÷ 366 days). Sources: FLHSMV; U.S. Census Bureau.
- Pedestrian and bicyclist crashes rose while overall crashes fell. From 2021 to 2024, pedestrian crashes in Miami-Dade rose 24.3% (1,509 → 1,876) and bicyclist crashes rose 25.9% (795 → 1,001). Over the same period, all crashes in the county fell 4.1% (62,536 → 60,000). Source: FLHSMV.
- Pedestrians and bicyclists make up a growing share of everyone injured. Pedestrian and bicyclist injuries in Miami-Dade rose from 1,930 in 2021 to 2,428 in 2024 (+25.8%). Injuries in all county crashes rose 2.3% (28,706 → 29,359). The pedestrian and bicyclist share of all people injured therefore went from 6.7% to 8.3%. Source: FLHSMV.
- Miami-Dade does not lead on every measure. Pedestrian deaths in the county fell from 101 in 2023 to 75 in 2024. Per resident, Miami-Dade’s 2024 pedestrian fatality rate (2.67 per 100,000) was below the statewide rate (2.91), and so were its bicyclist crash, injury and fatality rates. For bicyclists, Broward — not Miami-Dade — recorded the most crashes, injuries and deaths in 2024. Sources: FLHSMV; U.S. Census Bureau.
Counts are crashes involving a pedestrian or bicyclist, as recorded by FLHSMV. They are not findings about who was at fault. Source: FLHSMV, Florida Traffic Crash Facts, 2022–2024 editions; U.S. Census Bureau, Vintage 2025 population estimates.
The numbers in context
FLHSMV groups pedestrians, bicyclists and motorcyclists as “vulnerable road users,” which it defines as road users “who have the potential for a disproportionately high fatality rate.” This study looks at people on foot and on bicycles. Motorcyclists are left out on purpose because they are a different population, with different exposure and different legal issues.
In Miami-Dade, the share of traffic deaths who were walking or biking was higher than the statewide share in every year from 2022 to 2024. Most of that comes from pedestrians. Pedestrians alone were 30.4%, 31.1% and 27.6% of the county’s traffic deaths in those three years. Statewide, the pedestrian share was 22.1%, 23.4% and 21.9%.
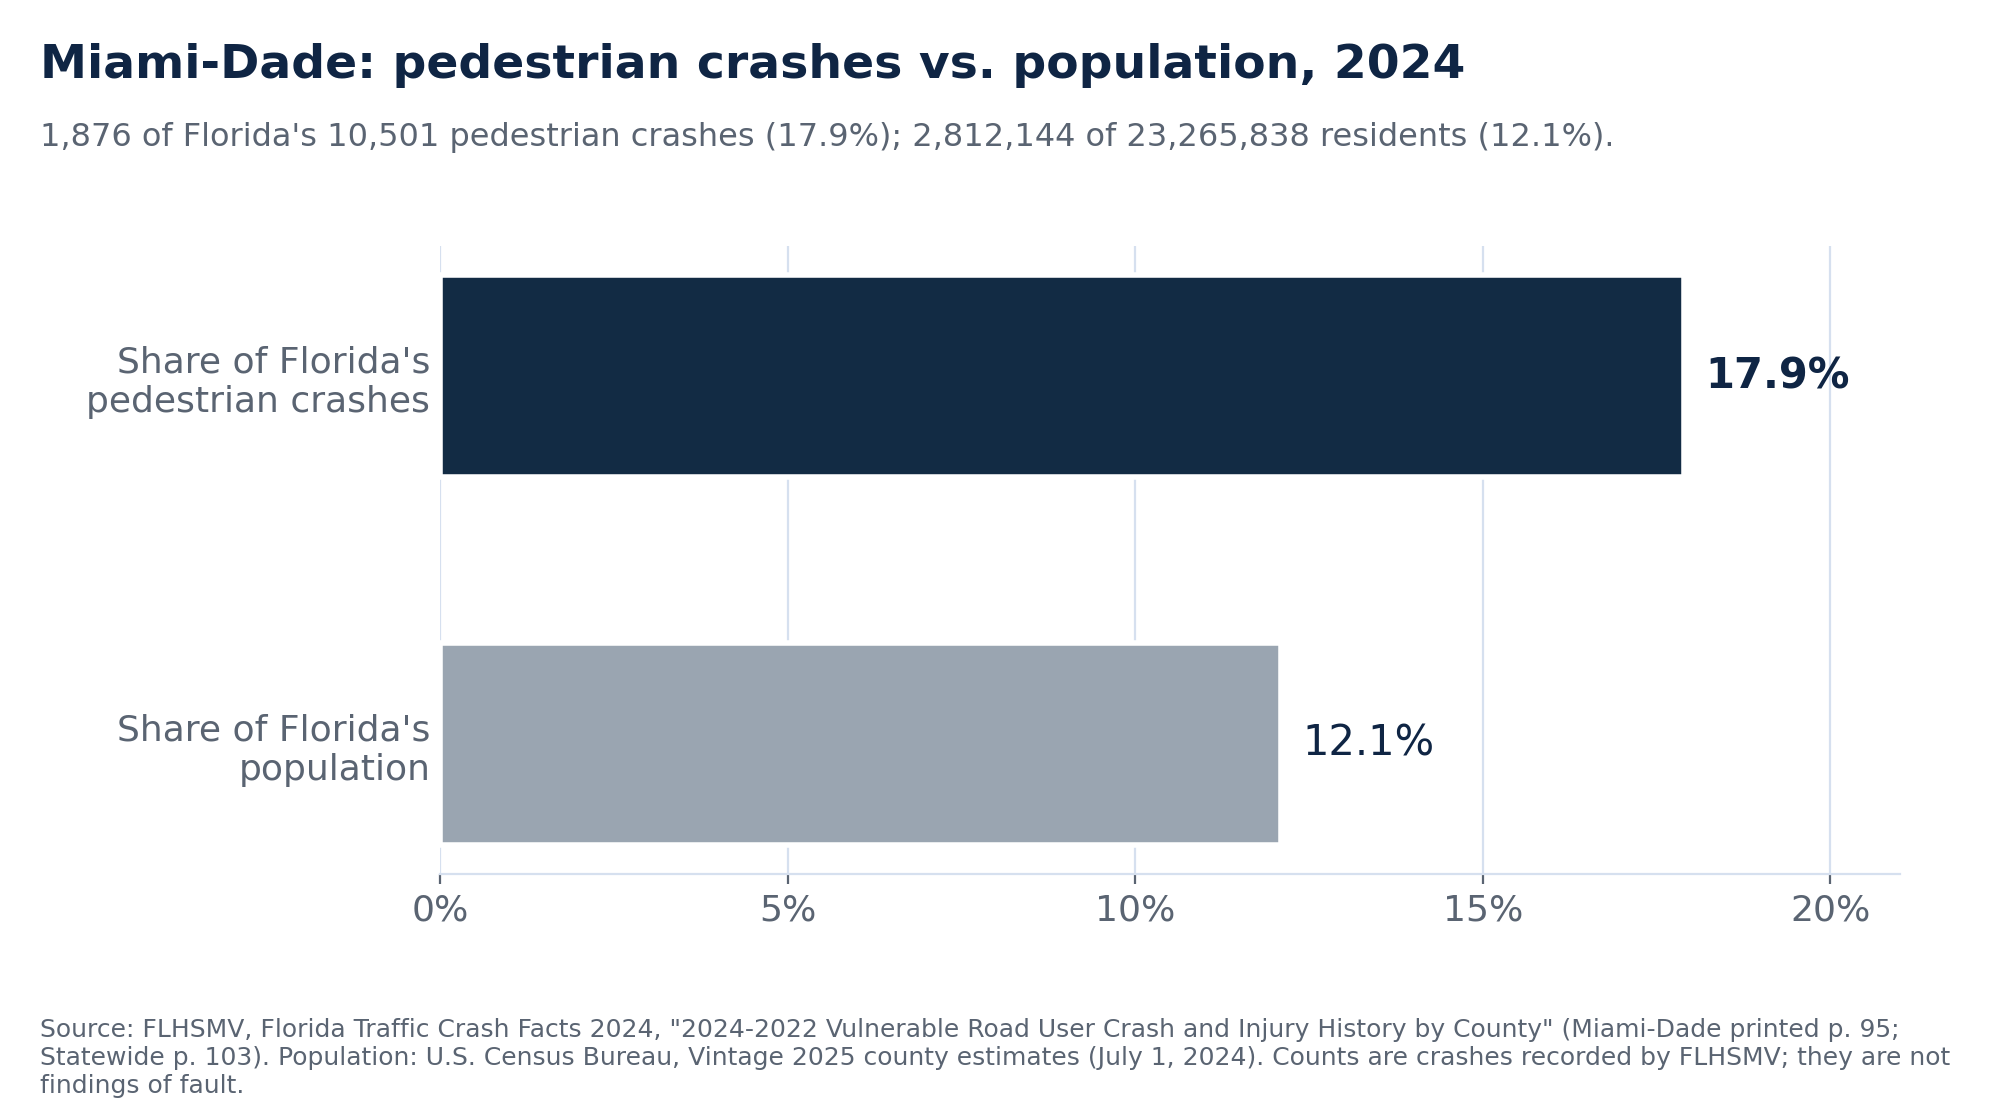
Miami-Dade has more residents than any other Florida county, so a high raw count is expected. The population comparison is the more useful measure. The county had 12.1% of Floridians (2,812,144 of 23,265,838, Census estimate for July 1, 2024) and 17.9% of the state’s pedestrian crashes. Per 100,000 residents, the county recorded 66.7 pedestrian crashes and 53.4 pedestrian injuries in 2024, against 45.1 and 36.1 statewide.
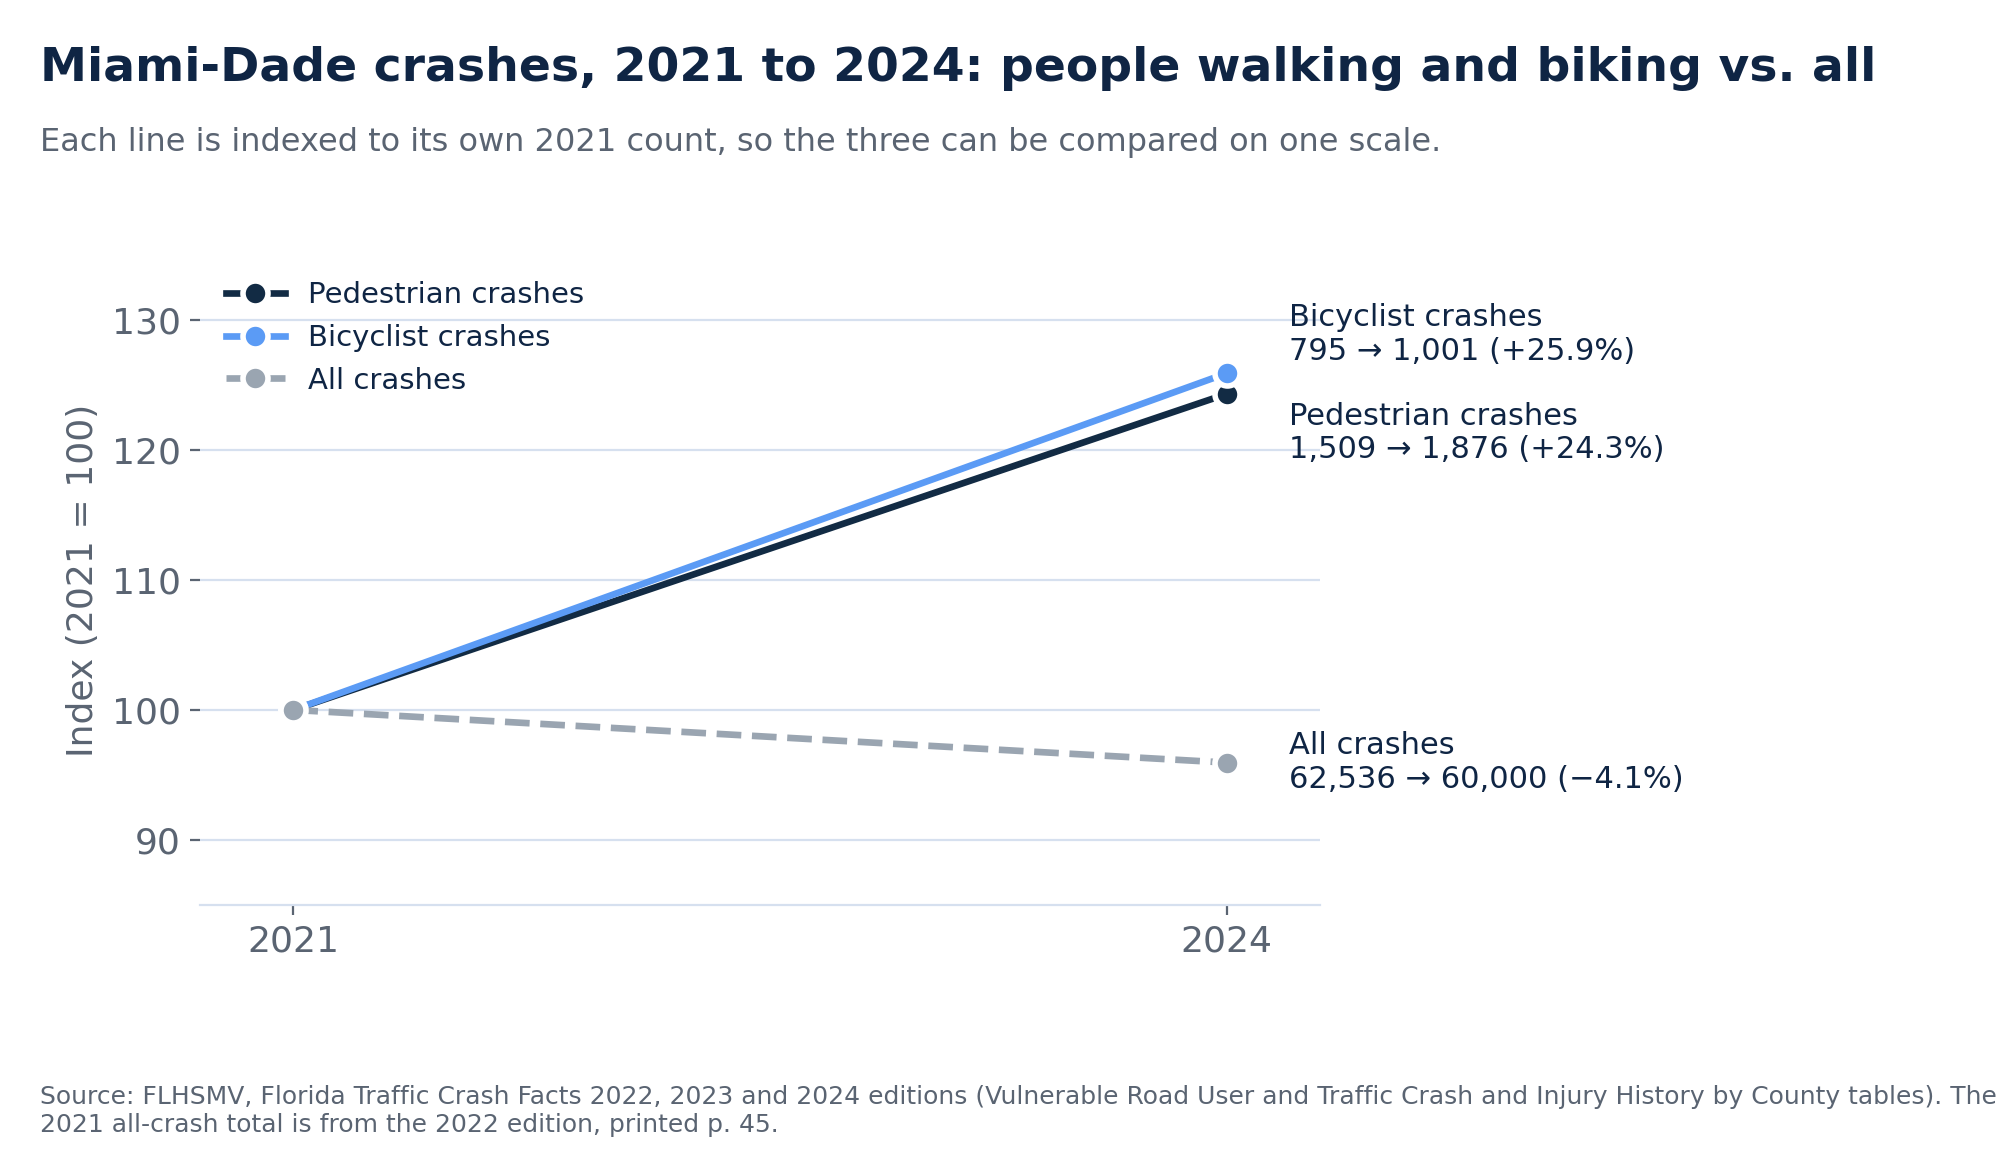
The trend starts in 2021 rather than 2020 because 2020 traffic was affected by the pandemic, which would make any increase look larger. Crashes are compared only with crashes, and injuries only with injuries.
Data tables
| Measure | 2022 | 2023 | 2024 | 2022–2024 |
|---|---|---|---|---|
| Miami-Dade pedestrian fatalities | 94 | 101 | 75 | — |
| Miami-Dade bicyclist fatalities | 17 | 19 | 20 | — |
| Miami-Dade pedestrian + bicyclist fatalities | 111 | 120 | 95 | 326 |
| All Miami-Dade traffic fatalities | 309 | 325 | 272 | 906 |
| Miami-Dade pedestrian + bicyclist share | 35.9% | 36.9% | 34.9% | 36.0% |
| Miami-Dade pedestrian-only share | 30.4% | 31.1% | 27.6% | — |
| Florida pedestrian fatalities | 786 | 791 | 678 | — |
| Florida bicyclist fatalities | 220 | 234 | 209 | — |
| Florida pedestrian + bicyclist fatalities | 1,006 | 1,025 | 887 | 2,918 |
| All Florida traffic fatalities | 3,553 | 3,375 | 3,098 | 10,026 |
| Florida pedestrian + bicyclist share | 28.3% | 30.4% | 28.6% | 29.1% |
| Florida pedestrian-only share | 22.1% | 23.4% | 21.9% | — |
| Measure | 2021 | 2024 | Change |
|---|---|---|---|
| Pedestrian crashes | 1,509 | 1,876 | +24.3% |
| Bicyclist crashes | 795 | 1,001 | +25.9% |
| All traffic crashes (county) | 62,536 | 60,000 | −4.1% |
| Pedestrian injuries | 1,201 | 1,503 | |
| Bicyclist injuries | 729 | 925 | |
| Pedestrian + bicyclist injuries | 1,930 | 2,428 | +25.8% |
| All traffic injuries (county) | 28,706 | 29,359 | +2.3% |
| Pedestrian + bicyclist share of all injuries | 6.7% | 8.3% |
Pedestrian crashes and bicyclist crashes are reported separately and never added together, because one crash can involve both. Injuries and deaths are person counts, so pedestrian and bicyclist figures can be added.
| Measure (2024) | Miami-Dade | Rank of 67 |
|---|---|---|
| Pedestrian crashes | 1,876 | 1 |
| Pedestrian fatalities | 75 | 1 |
| Pedestrian injuries | 1,503 | 1 |
| Bicyclist crashes | 1,001 | 2 (Broward 1,008) |
| Bicyclist fatalities | 20 | 2 (Broward 22) |
| Bicyclist injuries | 925 | 2 (Broward 951) |
| Measure | Miami-Dade | Florida |
|---|---|---|
| Pedestrian crashes | 66.7 | 45.1 |
| Pedestrian injuries | 53.4 | 36.1 |
| Pedestrian fatalities | 2.67 | 2.91 |
| Bicyclist crashes | 35.6 | 40.1 |
| Bicyclist injuries | 32.9 | 37.9 |
| Bicyclist fatalities | 0.71 | 0.90 |
Rates are per resident (population July 1, 2024: Miami-Dade 2,812,144; Florida 23,265,838). They are not rates per mile walked or ridden, and they do not account for visitors or commuters. Across 2022–2024 combined, Miami-Dade ranked first among the 67 counties in pedestrian crashes (5,516), pedestrian fatalities (270), bicyclist crashes (2,891) and bicyclist fatalities (56).
Methodology
- Source of record. All crash, fatality and injury counts come from FLHSMV’s annual Florida Traffic Crash Facts reports, which are the state’s statistics of record. We used the 2024, 2023 and 2022 editions. Each edition reports three years. As of September 26, 2026, FLHSMV’s reports page did not list a 2025 edition, so 2024 is the latest year available.
- Tables used. “2024-2022 Vulnerable Road User Crash and Injury History by County” (2024 edition; Miami-Dade printed p. 95, Statewide p. 103). The same table is titled “Vulnerable Road User Crash and Injury History by County” in the 2023 edition (Miami-Dade printed p. 94) and the 2022 edition (Miami-Dade printed p. 95). We also used “2024-2022 Traffic Crash and Injury History by County” (Miami-Dade p. 59, Statewide p. 61) and, in the 2022 edition, “Florida Traffic Crash & Injury History by County” (p. 45) for the 2021 county totals. Page numbers are the printed page numbers.
- Validation. For every measure (crashes, fatalities, injuries) and every year (2022, 2023, 2024), the 67 county figures sum exactly to the Statewide row FLHSMV publishes in the same table — 36 of 36 checks. Statewide pedestrian and bicyclist totals also match FLHSMV’s summary table (printed p. 10). Where two editions cover the same year, we found no restatements. Other statewide tables that FLHSMV itself notes may not give a true count of fatalities and injuries were not used.
- Definitions. FLHSMV defines a pedestrian as “an individual involved in a crash who was not occupying a Motor Vehicle, Bicycle or other mobile conveyance.” A traffic fatality is a death “within thirty days of the crash occurrence.” We add pedestrian and bicyclist fatalities, and pedestrian and bicyclist injuries, because they are separate groups of people. We do not add pedestrian crashes to bicyclist crashes, because one crash could appear in both counts.
- Population. U.S. Census Bureau, Vintage 2025 county population estimates, July 1, 2024 values (Miami-Dade 2,812,144; Florida 23,265,838).
- Arithmetic. Every percentage on this page is calculated directly from the counts shown, and each is given with its numerator and denominator.
- Limits. These counts record crashes involving a pedestrian or bicyclist. They say nothing about who was at fault. Counts are by where the crash happened, not where the people involved live. Per-resident rates do not measure exposure, such as miles walked or ridden.
What we looked for and chose not to publish
- Street-by-street or intersection counts. FLHSMV’s published tables stop at the county level. Engineering and analytics crash tools are either not the state’s statistics of record or not open to the public, so we do not attach crash counts to individual roads.
- Time of day and lighting in Miami-Dade. The annual report does not publish these by county, so we make no county-level claim about them.
- A finding that Miami-Dade is the most dangerous county for pedestrians. The data does not support it. Per resident, the county’s pedestrian fatality rate was below the statewide rate in 2024, and we report that above.
Safety steps for people walking, biking and driving
- Drivers: Florida law requires at least 3 feet of space when passing a bicycle in the same lane (s. 316.083, Fla. Stat.). At a signal, it requires drivers to stop and remain stopped for a pedestrian crossing with a permitted signal (s. 316.130(7)(a)).
- Bicyclists: Between sunset and sunrise, Florida law requires a white front light and a red rear light and reflector (s. 316.2065(7), Fla. Stat.). Brighter lights and reflective gear make you easier to see.
- Pedestrians: Cross at signals and marked crosswalks when you can. Make eye contact with turning drivers, and put the phone away while crossing.
- Everyone: Slow down near schools, transit stops and shopping plazas, where people on foot and on bikes cross often.
- If you are hit: Call 911, get medical care right away, photograph the scene and the vehicle, and write down witnesses’ names. In Florida, the deadline to file most negligence claims is generally two years for incidents after March 24, 2023.
Related resources: Miami pedestrian accident lawyer · Miami bicycle accident lawyers · Your rights after a pedestrian or bicycle crash in South Miami-Dade · Companion study: commercial motor vehicle crashes in Miami-Dade
About this study. Prepared by Jimenez Mazzitelli Mordes, a bilingual (English/Spanish) litigation and personal injury law firm headquartered in Miami, serving Florida, Texas & New York. Reporters may reuse the figures and charts with attribution to FLHSMV and a link to this page. Questions about the data: info@jmmlawfirm.com · (305) 548-8750.
Sources
- FLHSMV, Florida Traffic Crash Facts 2024: https://www.flhsmv.gov/pdf/crashreports/2024-Crash-Report.pdf (Vulnerable Road User table printed pp. 81–103, Miami-Dade p. 95, Statewide p. 103; Traffic Crash and Injury History by County, Miami-Dade p. 59, Statewide p. 61; summary p. 10; definitions pp. 4–7). Retrieved 2026-09-26.
- FLHSMV, Florida Traffic Crash Facts 2023: https://www.flhsmv.gov/pdf/crashreports/crash_facts_2023.pdf (Vulnerable Road User table, Miami-Dade printed p. 94; Statewide p. 106). Retrieved 2026-09-26.
- FLHSMV, Florida Traffic Crash Facts 2022: https://www.flhsmv.gov/pdf/crashreports/crash_facts_2022.pdf (Vulnerable Road User table, Miami-Dade printed p. 95; Florida Traffic Crash & Injury History by County p. 45). Retrieved 2026-09-26.
- FLHSMV, crash and citation reports index: https://www.flhsmv.gov/resources/crash-citation-reports/ (checked 2026-09-26; no 2025 edition listed).
- U.S. Census Bureau, County Population Totals, Vintage 2025: https://www2.census.gov/programs-surveys/popest/datasets/2020-2025/counties/totals/co-est2025-alldata.csv. Retrieved 2026-09-26.
- Florida Statutes s. 316.083, s. 316.130 and s. 316.2065: http://www.leg.state.fl.us/statutes/ (retrieved 2026-09-26).

